9월 수출 83.5% 급증 사상 최대 — 반도체 웃고 자동차는 왜 줄었나Korea September Exports Hit a Record, Up 83.5%: Why Cars Lag Behind Chips
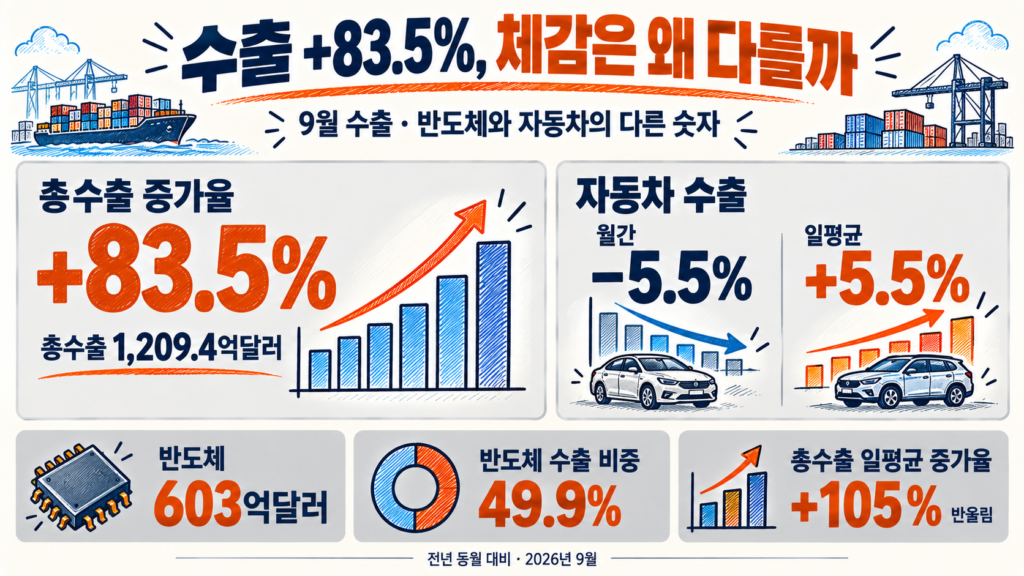
9월 수출이 전년 같은 달보다 83.5% 늘어난 1,209.4억달러를 기록했습니다. 반도체는 603억달러로 처음 600억달러를 넘었지만 자동차 수출은 감소했습니다. 이 차이는 호황이 얼마나 큰지보다, 무엇을 더 비싸게 얼마나 팔았고 며칠 동안 수출했는지를 나눠 보면 이해하기 쉽습니다. 출처: KDI · 산업통상부 발표 요약, 2026-10-01
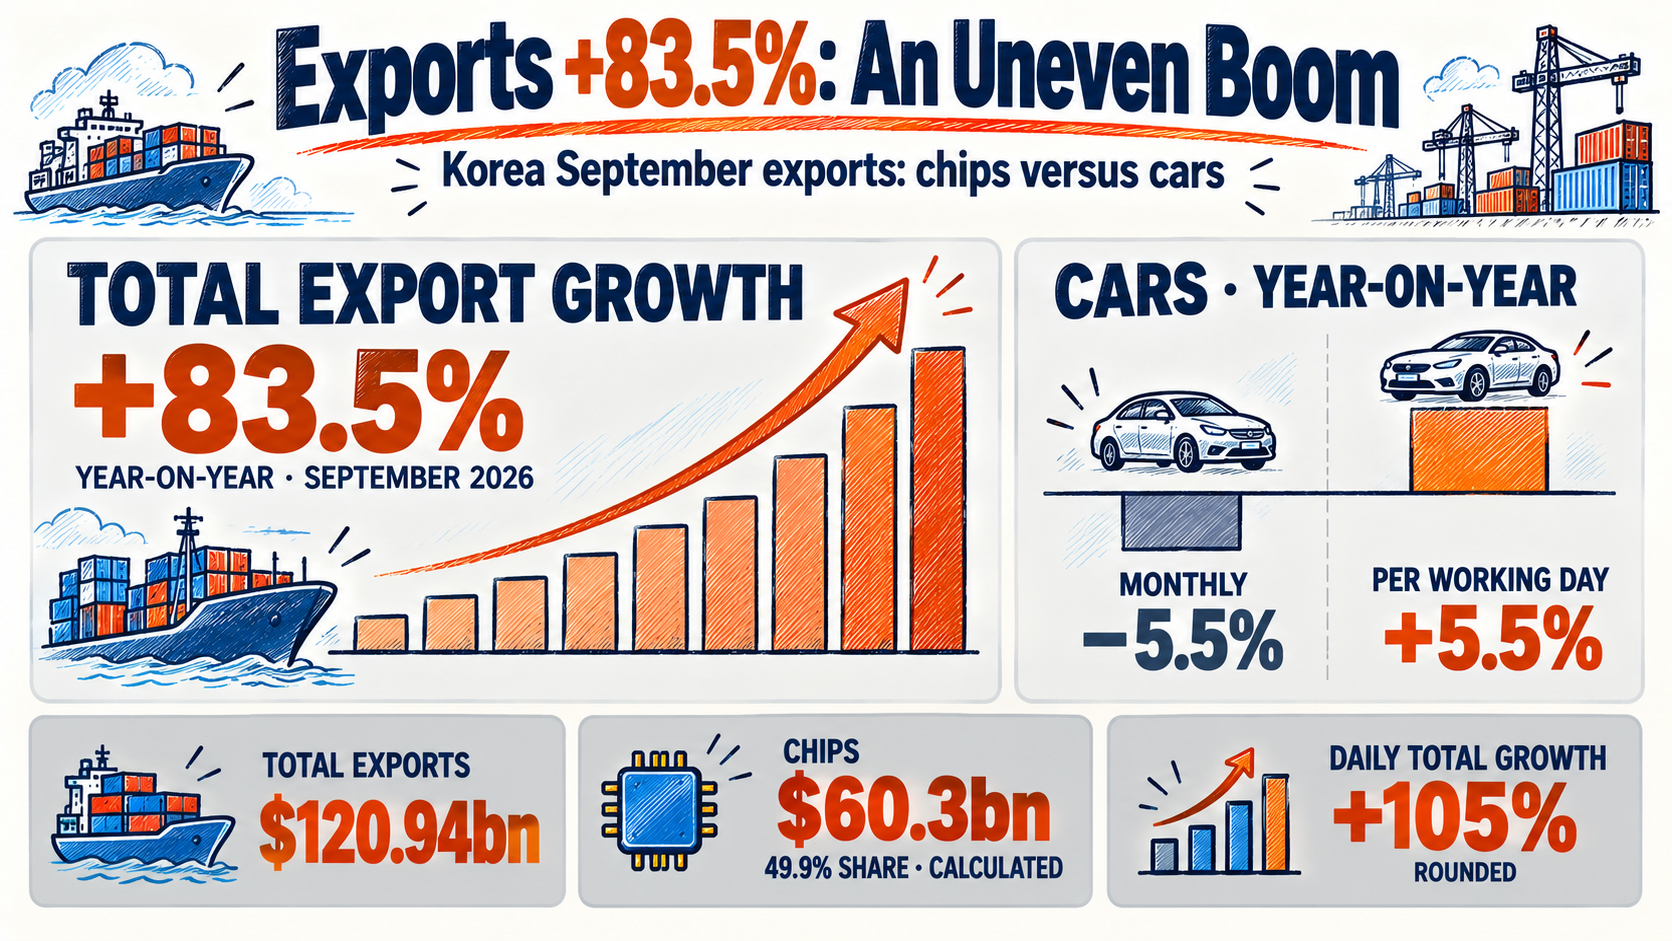
Korea September exports rose 83.5% from a year earlier to $120.94 billion. Chips crossed $60 billion for the first time, while automobile exports fell. To understand that contrast, separate what exporters sold, the prices they received and the working days available. Source: KDI · 산업통상부 발표 요약, 2026-10-01
수출 신기록은 분명 좋은 소식입니다. 다만 수출액은 기업의 순이익도, 가계가 당장 쓸 수 있는 소득도 아닙니다. 반도체 회사의 수주가 늘어도 다른 제조업체는 원료비와 이자 부담 때문에 투자를 미룰 수 있습니다. 이번 발표에서 읽어야 할 것은 그 사이의 연결입니다.
아래 수치는 10월 1일 잠정 통관 기준입니다. 특정 종목 매수·매도 권유는 아닙니다.
9월 수출의 절반은 반도체, 나머지 절반도 23% 늘었습니다
총수출 가운데 반도체가 차지한 몫은 약 49.9%입니다. 산업통상부 발표액 603억달러를 총액으로 나눈 자체 계산입니다. 반도체를 제외한 수출도 합계로는 전년보다 23% 늘었습니다. 따라서 한국 수출 전체를 반도체 하나로 설명하는 것도, 모든 업종이 비슷하게 좋아졌다고 보는 것도 정확하지 않습니다. 출처: 산업통상부 · 총괄 및 품목
9월 수출액, 반도체와 나머지. 산업통상부 2026-10-01. 비반도체606.4=총1209.4−반도체603, 자체 계산. 증가율 비교가 아닙니다. · 축이 0이 아니라 600에서 시작합니다
합계가 커지는 속도는 규모가 큰 업종에 더 많이 좌우됩니다. 반도체처럼 비중이 큰 품목의 매출이 뛰면, 작은 업종 여러 곳이 부진해도 전체 숫자는 강해 보일 수 있습니다. 위 막대에서 반도체 한 품목의 수출액은 나머지 품목을 모두 합친 금액과 거의 같습니다. 비반도체 막대 안에는 자동차와 기계, 소비재처럼 서로 다른 고객과 비용 구조를 가진 업종이 함께 들어 있습니다.
기업 실적을 볼 때도 마찬가지입니다. 한국 수출 증가율을 특정 기업의 매출 전망에 그대로 붙이면 안 됩니다. 그 기업이 어떤 제품을 어느 나라에 팔고, 계약 가격은 언제 바뀌는지까지 내려가야 수출 통계와 손익계산서가 연결됩니다.
AI 투자 수요는 가격과 물량을 함께 움직입니다
반도체 수출 증가는 많이 판 효과와 비싸게 판 효과를 함께 담고 있습니다. 산업통상부는 메모리 물량 확대와 고정가격 상승을 함께 설명했습니다. 여기서 고정가격은 거래 계약에 쓰이는 가격 지표입니다. 일부 규격의 가격을 모든 반도체의 평균 수출단가로 읽어서는 안 됩니다. 출처: 산업통상부 · IT 품목 설명
왜 AI 투자가 메모리 회사의 매출로 이어질까요. AI 서비스를 돌리는 데이터센터는 계산용 칩뿐 아니라 데이터를 빠르게 주고받는 메모리와 저장장치도 필요합니다. 특히 HBM은 여러 메모리 칩을 쌓아 데이터 전송 능력을 높인 제품입니다. 이런 고가 제품의 판매 비중이 커지면 출하 개수가 같은 폭으로 늘지 않아도 수출액은 크게 증가할 수 있습니다.
SK하이닉스는 7월 29일 2분기 실적 발표에서 AI 인프라 수요와 고부가 메모리 판매를 실적 개선의 배경으로 들었습니다. 주요 고객 약 10곳과 장기계약을 맺었다는 설명도 내놨습니다. 고객 수요가 일회성 주문을 넘어서는지 판단할 재료이지만, 앞으로의 수요 지속은 회사의 전망입니다. 출처: SK hynix · 2026-07-29
수요가 늘어도 생산라인과 숙련 인력, 칩을 조립하고 검사하는 설비를 곧바로 늘릴 수는 없습니다. 공급을 빠르게 늘리기 어려우면 가격 협상에서 판매자가 유리해질 수 있습니다. 반대로 그 메모리를 사서 서버나 전자제품을 만드는 기업은 원가가 높아집니다. 같은 AI 투자 확대가 공급망의 모든 기업에 같은 이익을 주지는 않는 이유입니다.
가격과 물량이 각각 몇 %를 기여했는지는 이번 발표만으로는 알 수 없습니다. 수출액 급증을 실질 생산량 급증으로 바꾸어 읽으면 호황의 크기를 잘못 판단할 수 있습니다.
자동차 −5.5%와 +5.5%, 둘 다 맞는 이유
자동차는 60.5억달러로 전년 동월보다 5.5% 감소했습니다. 그러나 하루 평균 수출액은 5.5% 늘었습니다. 같은 자동차 수출인데 부호가 정반대입니다. 둘 중 하나가 틀린 걸까요? 아닙니다. 산업통상부는 추석 시점 이동과 중고차 수출 부진을 월간 감소의 배경으로 설명했습니다. 출처: 산업통상부 · 모빌리티
조업일수가 지난해 24일에서 올해 21.5일로 줄었다는 점이 중요합니다. 가게가 하루에 더 많이 팔아도 문을 연 날이 줄면 월 매출은 감소할 수 있는 것과 같습니다. 자동차 월간 수출이 전년의 94.5%라는 값에 24÷21.5를 곱하면 하루 기준으로는 약 105.5%가 됩니다. 발표된 일평균 증가율과 맞아떨어지는 근사 계산입니다. 출처: Aju Press · 조업일수, 2026-10-01
월간 합계
−5.5%
증감률
포함 요인 · 줄어든 조업일수
일평균
+5.5%
증감률
계산 · 월간 수출액 ÷ 조업일수
이 달력 효과는 총수출에도 적용됩니다. Reuters는 일평균 수출 증가율을 104.9%로 보도했고, 산업통상부는 이를 반올림해 105%로 제시했습니다. 솔직히 이번 발표에서 가장 눈에 띄는 대목입니다. 일할 날이 2.5일 적었는데도 사상 최대였습니다. 줄어든 조업일수는 오히려 월간 증가율을 낮췄습니다. 출처: Reuters · 2026-10-01
그렇다고 자동차 수요가 전반적으로 강해졌다고 단정할 수도 없습니다. 일평균은 수출액을 조업일수로 나눈 값입니다. 판매 대수도 아니고, 신차와 중고차의 구성을 고정한 지표도 아니며, 모든 계절 요인을 제거한 수치도 아닙니다. 완성차 회사의 실적을 보려면 지역별 판매와 할인, 해외 공장 생산을 따로 확인해야 합니다.
석유제품 수출 72% 늘었는데 물량은 줄었습니다: 매출과 이익의 차이
석유제품이 좋은 비교 사례입니다. 9월 수출액은 72% 늘었지만 수출물량은 6.9% 줄었습니다. 원유 수입단가도 35.7% 상승했습니다. 더 많은 제품을 팔아서 생긴 호황과, 원료와 제품 가격이 함께 올라 커진 매출은 손익에 미치는 영향이 다릅니다. 출처: 산업통상부 · 석유제품 및 수입
정유기업에는 제품 판매가격에서 원유와 가공 비용을 뺀 차이가 중요합니다. 매출이 커져도 그 차이가 좁아지면 이익은 기대에 못 미칠 수 있습니다. 반도체도 마찬가지로 판매가격 외에 수율, 전력비, 장비 감가상각을 봐야 합니다. 수율은 투입한 생산량 중 정상 제품이 나오는 비율이고, 감가상각은 비싼 설비 값을 사용 기간에 나눠 비용으로 반영하는 방식입니다.
국내 소재·장비 협력업체의 상황은 또 다릅니다. 고객사의 메모리 판매가격이 올라도 납품계약 단가가 그대로라면 이익이 자동으로 늘지는 않습니다. 새 장비 주문, 부품 교체, 납품량 확대가 실제로 발생해야 매출에 반영됩니다. 반도체라는 같은 이름 아래에서도 완제품 업체와 협력업체의 실적 시점이 갈리는 이유입니다.
장관과 한은 총재의 발언으로 본 수출 호황: 다음은 국내 발주입니다
김정관 산업통상부 장관은 10월 1일 발표에서 수출 성과를 평가하면서도 보호무역과 중동 긴장을 주요 변수로 짚었습니다. 신현송 한국은행 총재는 앞선 8월 27일 기자간담회에서 반도체 호조와 소득 개선을 성장의 근거로 들면서 물가 확산에 선제적으로 대응할 필요를 설명했습니다. 두 발언을 함께 읽으면, 강한 수출과 비용·금리 부담이 동시에 존재할 수 있다는 점이 보입니다. 출처: 신현송 총재 · 2026-08-27; 김정관 장관 발언은 산업통상부 10월1일 자료 출처: 김정관 장관 · 2026-10-01
한국은행 금융통화위원회는 8월 27일 기준금리를 2.75%에서 3.00%로 올렸습니다. 이는 9월 수출 발표 이전의 결정입니다. 이번 수출액 하나로 다음 금리 결정을 예측할 수는 없지만, 수출 호황이 반드시 금리 인하와 함께 오는 것은 아니라는 점을 보여 줍니다. 내수가 약한 기업은 수출기업의 좋은 소식과 별개로 대출 이자를 감당해야 합니다. 출처: 한국은행 · 통화정책방향, 2026-08-27
내수로 이어지려면 수출기업에 남은 현금이 국내 공장과 연구개발, 협력업체 주문으로 들어가고, 그것이 임금과 고용으로 연결되어야 합니다. 자동화 투자는 생산능력을 크게 늘리면서도 신규 고용은 적게 만들 수 있고, 성과급은 채용보다 먼저 소비에 영향을 줄 수 있습니다.
-
1
기업 현금
원가·세금 등을 뺀 여력
-
2
국내 발주
공장·연구개발·협력사
-
3
가계 소득
임금·고용·배당
-
4
소비 확산
저축·상환을 제외한 지출
SK하이닉스가 7월 실적 발표에서 생산능력 확충과 투자 규율을 함께 강조한 점도 이 맥락에서 읽을 만합니다. 기업은 수요가 좋아도 모든 돈을 한꺼번에 쓰지 않습니다. 국내 건설·설비 계약이 확정되고 협력업체가 납품을 시작해야 투자 효과가 넓어집니다. 이후 임금·배당을 받은 가계가 저축이나 대출 상환보다 소비를 얼마나 늘리는지도 중요합니다. 출처: SK hynix · 투자 방침, 2026-07-29
반도체 장비 수입이 늘어나는 것도 무조건 나쁜 신호는 아닙니다. 해외 장비를 국내 공장에 설치한다면 당장의 수입은 증가해도 이후 국내 생산능력을 키울 수 있습니다. 다만 그 장비 대금 전부가 국내 장비업체의 매출이 되는 것은 아닙니다. 투자 장소와 공급업체 소재지를 구분해야 국내 파급을 제대로 읽을 수 있습니다.
앞서 다룬 관련: 반도체 호황과 고용의 시차도 이 흐름과 맞물립니다. 이번에는 수출 기록 자체보다 국내 발주가 넓어지는지, 협력업체의 수주잔고가 실제 매출로 바뀌는지, 채용과 지역 소비가 뒤따르는지를 확인하는 편이 더 유용합니다.
무역흑자 498.5억달러, 원화 강세와 주가로 바로 이어질까요
9월 무역흑자는 498.5억달러입니다. 수출에서 수입을 뺀 통관 기준 결과이며, 같은 달 외환시장에서 이만큼의 달러가 원화로 바뀌었다는 뜻은 아닙니다. 수출기업이 대금을 언제 받는지, 외화로 보관하는지, 수입 원료나 해외투자에 쓰는지에 따라 실제 환전 수요가 달라집니다. 출처: Reuters · 무역수지
국내 임금과 공사비를 지급하려고 달러를 많이 팔면, 다른 조건이 같을 때 원화 강세 압력이 커질 수 있습니다. 반대로 달러를 해외 공장 투자나 장비 결제에 사용하면 그 효과는 작아집니다. 외국인의 국내 증권 매매와 한국 투자자의 해외자산 매입까지 겹치므로, 무역흑자만으로 환율 목표치를 제시하기는 어렵습니다.
원화 강세도 모든 기업에 같은 호재는 아닙니다. 달러로 버는 수출기업은 같은 외화 매출을 원화로 환산했을 때 금액이 줄 수 있습니다. 반면 달러 원료와 에너지를 사는 기업에는 비용 완화가 될 수 있습니다. 실제 이익은 외화 매출과 비용의 차이, 미리 환율을 정해 둔 계약까지 봐야 합니다. 관련: 원달러 환율과 자금 흐름을 다룬 글에서 이어지는 질문입니다.
주식시장에서는 실적과 기대를 나눠야 합니다. 제공된 10월 1일 12:24 UTC 스냅샷에서 미국 CNN 공포·탐욕 지수는 30.7로 공포입니다. 1주 전 35.7보다 5.0포인트, 1개월 전 44.9보다 14.1포인트 낮습니다. 반면 GoldKimp의 9월 30일 KOSPI 지수는 59.3으로 탐욕입니다. 수출 호조와 미국의 위험 선호 약화가 함께 나타나는 환경이라는 뜻이지, 어느 시장이 곧 오를지 알려 주는 신호는 아닙니다. 출처: CNN · 제공 스냅샷, 2026-10-01 출처: GoldKimp · 2026-09-30
두 지수는 산식과 날짜가 달라 점수 차이를 직접 비교하기 어렵습니다. 같은 KOSPI 시계열의 1주·1개월 전 값이 없어 한국 쪽 추세는 아직 판단할 자료가 없습니다. 반도체 실적이 좋아도 이미 주가에 반영된 기대보다 약하면 주가가 하락할 수 있습니다.
SentimenTrader의 Smart Money·Dumb Money는 투자 행동 지표를 묶은 시장 낙관도 모형입니다. 공식 홈페이지의 최신값은 표시되지 않았고, 확인 가능한 공개 게시물 재현본의 9월 24일 수치는 각각 41%·35%입니다. 공식 최신값은 아니라는 점만 기억해 두면 됩니다. 수출기업 주가를 볼 때도 이 지수보다 실적이 시장의 기대를 얼마나 웃돌았는지가 중요합니다. 출처: SentimenTrader 공개 게시물 미러 · 2026-09-24 출처: SentimenTrader · 공식 홈페이지
다음 발표에서 볼 세 가지: 물량, 국내 설비투자, 고용
먼저 다음 수출 발표에서는 일평균 수출액과 품목별 물량을 함께 보겠습니다. 가격 상승이 둔화하더라도 물량이 늘면 매출을 뒷받침할 수 있습니다. 다음은 기업의 국내 설비투자 집행입니다. 투자 계획이 실제 발주와 협력업체 매출로 바뀌는지, 에너지·물류·이자 비용을 내고도 이익이 남는지가 중요합니다. 마지막은 고용입니다. 채용과 임금이 늘고 소매판매까지 따라와야 수출 호황이 가계 소비로 퍼졌다고 볼 수 있습니다.
1,209.4억달러는 한국 기업이 세계 시장에 실어 보낸 물건값입니다. 그만큼의 돈이 곧바로 국내 일자리와 소비가 되는 것은 아닙니다. 기업이 비용을 치른 뒤 얼마나 남기고, 그 돈을 어디에 쓰는지에 따라 우리가 체감할 호황의 크기도 달라집니다.
수출 신기록 다음에는 기업이 남긴 이익과 국내에 집행한 투자를 확인할 차례입니다.
출처
- 산업통상부 · 2026년 9월 수출입 동향 · 2026-10-01
- Reuters · September exports rise 83.5% · 2026-10-01
- KDI 경제교육·정보센터 · 산업통상부 발표 요약 · 2026-10-01
- 연합뉴스 · 반도체·자동차 수출 교차확인 · 2026-10-01
- Aju Press · 조업일수 21.5일과 전년 24일 · 2026-10-01
- 한국은행 · 8월 통화정책방향 · 2026-08-27
- 신현송 한국은행 총재 · 8월 기자간담회 · 2026-08-27
- SK하이닉스 · 2분기 실적과 투자 방침 · 2026-07-29
- CNN Fear & Greed · 제공 스냅샷 · 2026-10-01
- GoldKimp KOSPI Fear & Greed · 제공 스냅샷 · 2026-09-30
- SentimenTrader · 공식 페이지 수치 미표시 · 2026-10-01
- SentimenTrader 공개 게시물 재현 · 과거 수치 대체 확인 · 2026-09-24
A record is good news, but export revenue is neither net profit nor money immediately available to households. A chip supplier may receive more orders while another manufacturer postpones investment because of material costs and interest bills. The useful question is how the gains travel through the economy.
The trade figures below are provisional customs data released on October 1. This article is not a recommendation to buy or sell a stock.
Chips made up half of September exports; the other half grew 23% too
Chips accounted for about 49.9% of exports, calculated by dividing $60.3 billion by the total. Non-chip exports also rose 23% in aggregate. Neither “only chips are doing well” nor “every exporter is enjoying the same boom” describes the data accurately. Source: 산업통상부 · 총괄 및 품목
September exports: chips and the rest. MOTIR, Oct 1. Other goods = 1209.4 minus 603, editorial calculation. Values, not growth rates. · Axis starts at 600, not zero
An aggregate follows its largest components. A surge in a category as large as chips can dominate the total even when several smaller industries struggle. The chart shows one product category nearly matching all other goods combined. The second bar includes vehicles, machinery and consumer products, each with different customers and costs.
The same logic applies when reading company results. Korea’s export growth rate cannot simply be pasted into a sales forecast for an individual company. You need its product mix, customer locations and contract repricing schedule before trade data can inform an earnings estimate.
AI investment changes both volumes and the price mix
Chip export growth reflects both shipment expansion and stronger prices. The ministry identifies both channels. Contract-price indicators refer to specified products; they are not an average export price for every kind of semiconductor. Source: 산업통상부 · IT 품목 설명
An AI data center needs memory and storage as well as processors. HBM—high-bandwidth memory—stacks memory chips to deliver data quickly. Selling a larger share of expensive products can lift the export bill much faster than the number of units shipped. This product-mix effect sits alongside changes in like-for-like prices and volumes.
In its July 29 earnings release, SK hynix linked its results to AI infrastructure demand and high-value memory sales. It also reported long-term agreements with around ten customers. That helps assess the durability of demand, but management’s expectation that demand will persist remains a forecast. Source: SK hynix · 2026-07-29
Extra demand does not instantly create production lines, skilled staff or assembly and testing capacity. When supply responds slowly, sellers may gain pricing power. Buyers building servers or electronics face a higher input bill. The same investment cycle can therefore strengthen one company’s margin while squeezing another’s.
This release does not show how much of the increase came from prices and how much from volumes. Treating nominal export growth as an equally large increase in real output would overstate the boom.
Why cars can be down 5.5% and up 5.5% at the same time
Automobile exports were $6.05 billion, down 5.5% year on year, while exports per working day rose 5.5%. The same car exports, with opposite signs. Is one figure wrong? No. The ministry attributed the monthly decline to the shift in Chuseok holidays and weaker used-car exports. Source: 산업통상부 · 모빌리티
There were 21.5 working days, compared with 24 a year earlier. A shop can sell more each day yet report lower monthly revenue if it opens fewer days. Multiply the car-export ratio of 94.5% by 24 divided by 21.5 and the daily ratio is about 105.5%. This is an approximate calculation using rounded inputs. Source: Aju Press · 조업일수, 2026-10-01
Monthly total
−5.5%
Change
Includes · Fewer working days
Per working day
+5.5%
Change
Calculation · Monthly exports ÷ working days
The same calendar adjustment applies to total exports. Reuters reports daily growth of 104.9%; the ministry rounds it to 105%. To me, this is the most striking part of the release: exports hit a record with 2.5 fewer working days. The shorter calendar actually held down monthly growth. Source: Reuters · 2026-10-01
Daily export growth still does not establish that car demand strengthened everywhere. It measures dollars per working day, not vehicle units, a constant new-versus-used mix or a fully seasonally adjusted series. Company earnings also depend on regional sales, discounts and production at overseas factories.
Petroleum export revenue rose 72% while volumes fell: why profits can differ
Petroleum products offer a useful contrast: export revenue rose 72%, but volume fell 6.9%, while crude import prices rose 35.7%. Selling more product and reporting higher revenue because both input and output prices increased are different earnings stories. Source: 산업통상부 · 석유제품 및 수입
A refiner earns the difference between its selling price and the cost of crude and processing. Higher revenue may disappoint if that spread narrows. Chipmakers also face yields, power costs and depreciation. Yield measures how much production becomes usable product; depreciation spreads an equipment purchase over its useful life.
Domestic equipment and materials suppliers face another set of terms. A customer’s higher memory selling price does not automatically raise the supplier’s contract price. New equipment orders, replacement parts and larger deliveries must materialize first. Earnings can arrive at different times even within the semiconductor supply chain.
After the export boom, the test is domestic orders
Trade Minister Kim Jung-kwan praised the export result on October 1 while flagging protectionism and Middle East tensions. In an earlier August 27 press conference, Bank of Korea Governor Shin Hyun-song linked growth to chips and better incomes, while explaining the need to respond pre-emptively to spreading inflation. Strong exports and financing or cost pressures can coexist. Source: 신현송 총재 · 2026-08-27; 김정관 장관 발언은 산업통상부 10월1일 자료 Source: Minister Kim · 2026-10-01
On August 27, the Bank of Korea raised its policy rate from 2.75% to 3.00%, before these September trade numbers were released. One export report cannot predict the next policy decision. It does show why an export boom need not arrive with cheaper borrowing for businesses serving weaker domestic demand. Source: 한국은행 · 통화정책방향, 2026-08-27
For the gains to spread at home, cash retained by exporters must become local factory investment, research or supplier orders, then wages and jobs. Automation can expand capacity with limited hiring, while bonuses can affect spending before new jobs appear.
-
1
Company cash
After costs, taxes and other claims
-
2
Local orders
Factories, R&D and suppliers
-
3
Household income
Wages, jobs and dividends
-
4
Wider spending
After saving and debt repayment
SK hynix’s July statement paired capacity expansion with capital-spending discipline. Even in strong demand, a company need not spend all its cash immediately. Local construction and equipment contracts must be signed and fulfilled for the effects to spread. Households then decide how much extra income to consume, save or use to repay debt. Source: SK hynix · 투자 방침, 2026-07-29
More imported chipmaking equipment is not necessarily bad news. Equipment installed in a Korean factory can build future domestic capacity while raising imports today. But its purchase price does not all become revenue for Korean equipment makers. The location of investment and the supplier’s location are separate questions.
Our earlier discussion of Related: the gap between chip-led growth and jobs follows the same macro story. Beyond the export record, watch whether domestic orders broaden, supplier backlogs become revenue and hiring and local spending follow.
Will a $49.85 billion trade surplus lift the won and stocks?
September’s provisional trade surplus was $49.85 billion. That customs balance does not mean the same amount of dollars was sold for won in the currency market that month. Payment timing, foreign-currency deposits, imported inputs and overseas investment all affect actual conversion demand. Source: Reuters · 무역수지
If exporters sell more dollars to pay domestic wages and construction bills, that can support the won, other things equal. Spending the dollars on foreign factories or equipment weakens that direct conversion effect. Foreign securities flows and Korean purchases of overseas assets also matter. The trade surplus alone cannot establish an exchange-rate target.
A stronger won also has different earnings effects. Dollar revenue translates into fewer won, while dollar-priced inputs can become cheaper. The net result depends on the balance of foreign-currency revenue and costs, plus hedging contracts. This continues the questions raised in our Related: earlier discussion of USD/KRW and capital flows.
Stocks require a distinction between earnings and expectations. The supplied CNN snapshot at 12:24 UTC on October 1 reads 30.7, or Fear, down 5.0 points from a week earlier and 14.1 from a month earlier. GoldKimp’s September 30 KOSPI reading is 59.3, or Greed. Strong exports can coexist with weaker U.S. risk appetite; these readings do not predict which market will rise next. Source: CNN · 제공 스냅샷, 2026-10-01 Source: GoldKimp · 2026-09-30
The indices use different methods and dates, so their numerical gap is not directly comparable. Earlier weekly and monthly readings for the same KOSPI series are unavailable, leaving its trend unclear. Chip shares can fall despite strong results if those results disappoint expectations already embedded in prices.
SentimenTrader’s Smart Money and Dumb Money measures model market optimism using investor behavior indicators. The official homepage did not display current values. The latest accessible mirrored public headline was dated September 24: 41% and 35%. Keep in mind that these are not current official readings. For export stocks, whether earnings beat market expectations matters more than this snapshot. Source: SentimenTrader 공개 게시물 미러 · 2026-09-24 Source: SentimenTrader · 공식 홈페이지
Three things to watch next: volumes, domestic investment and jobs
Start with daily export values and product volumes in the next trade release. Higher volumes could support revenue even as price growth slows. Next, track actual domestic capital spending: are investment plans becoming supplier orders and sales, and are profits holding up after energy, logistics and interest costs? Finally, watch jobs. Hiring, wages and retail sales will show whether export gains are reaching household spending.
The $120.94 billion records the value of goods Korean companies shipped to world markets. It does not flow straight into domestic jobs and consumption. How much firms retain after costs, and where they spend it, will shape how widely the boom is felt.
After the export record, follow retained profits and investment actually made at home.
Sources
- 산업통상부 · 2026년 9월 수출입 동향 · 2026-10-01
- Reuters · September exports rise 83.5% · 2026-10-01
- KDI 경제교육·정보센터 · 산업통상부 발표 요약 · 2026-10-01
- 연합뉴스 · 반도체·자동차 수출 교차확인 · 2026-10-01
- Aju Press · 조업일수 21.5일과 전년 24일 · 2026-10-01
- 한국은행 · 8월 통화정책방향 · 2026-08-27
- 신현송 한국은행 총재 · 8월 기자간담회 · 2026-08-27
- SK하이닉스 · 2분기 실적과 투자 방침 · 2026-07-29
- CNN Fear & Greed · 제공 스냅샷 · 2026-10-01
- GoldKimp KOSPI Fear & Greed · 제공 스냅샷 · 2026-09-30
- SentimenTrader · 공식 페이지 수치 미표시 · 2026-10-01
- SentimenTrader 공개 게시물 재현 · 과거 수치 대체 확인 · 2026-09-24
이 글은 정보 제공 목적이며, 특정 자산의 매수·매도를 권유하지 않습니다.
For information only — this is not a recommendation to buy or sell any asset.
댓글Comments 0